See GPU memory before
it breaks your training.
Stormlog gives PyTorch and TensorFlow teams real-time GPU memory visibility, leak detection, diagnostics, and exportable timelines across CLI, Python API, and Textual TUI workflows.
A product surface built around real debugging pressure.
The goal is not just to collect numbers. Stormlog helps teams see GPU memory as it shifts, isolate signals worth acting on, and move from guesswork to repeatable workflow.
Watch memory shift while training is still running.
Track allocation, peak usage, and reserved memory in one place instead of stitching together shell commands and printouts.
Real-time monitoring
Follow GPU allocation as it changes mid-epoch, not after the crash report lands.
Threshold alerts
Apply warning and critical limits so risky runs surface immediately instead of after hours of wasted compute.
Interactive TUI
Inspect platform info, live tracking, exports, and diagnostics without opening a browser.
Pinpoint growth patterns before they become OOM crashes.
Move from vague symptoms to concrete signals you can act on, including suspicious allocation growth and distributed anomalies.
Leak detection
Identify suspicious growth patterns and isolate where memory starts drifting run over run.
Artifact diagnostics
Load exported snapshots and compare them later to trace distributed or intermittent issues with context intact.
Timeline views
Generate timeline plots and HTML artifacts to show how memory behaved across the full workload.
Fit Stormlog into the stack you already have.
Adopt the profiler incrementally, from quick CLI sessions to deeper instrumentation in Python-heavy training code.
CLI automation
Start monitoring or diagnostics sessions from the terminal without reworking your whole training loop.
Python hooks
Use decorators, context managers, and programmatic sessions when you need tighter profiling control.
CPU-compatible workflows
Prepare and test profiling routines before moving them onto production GPU infrastructure.
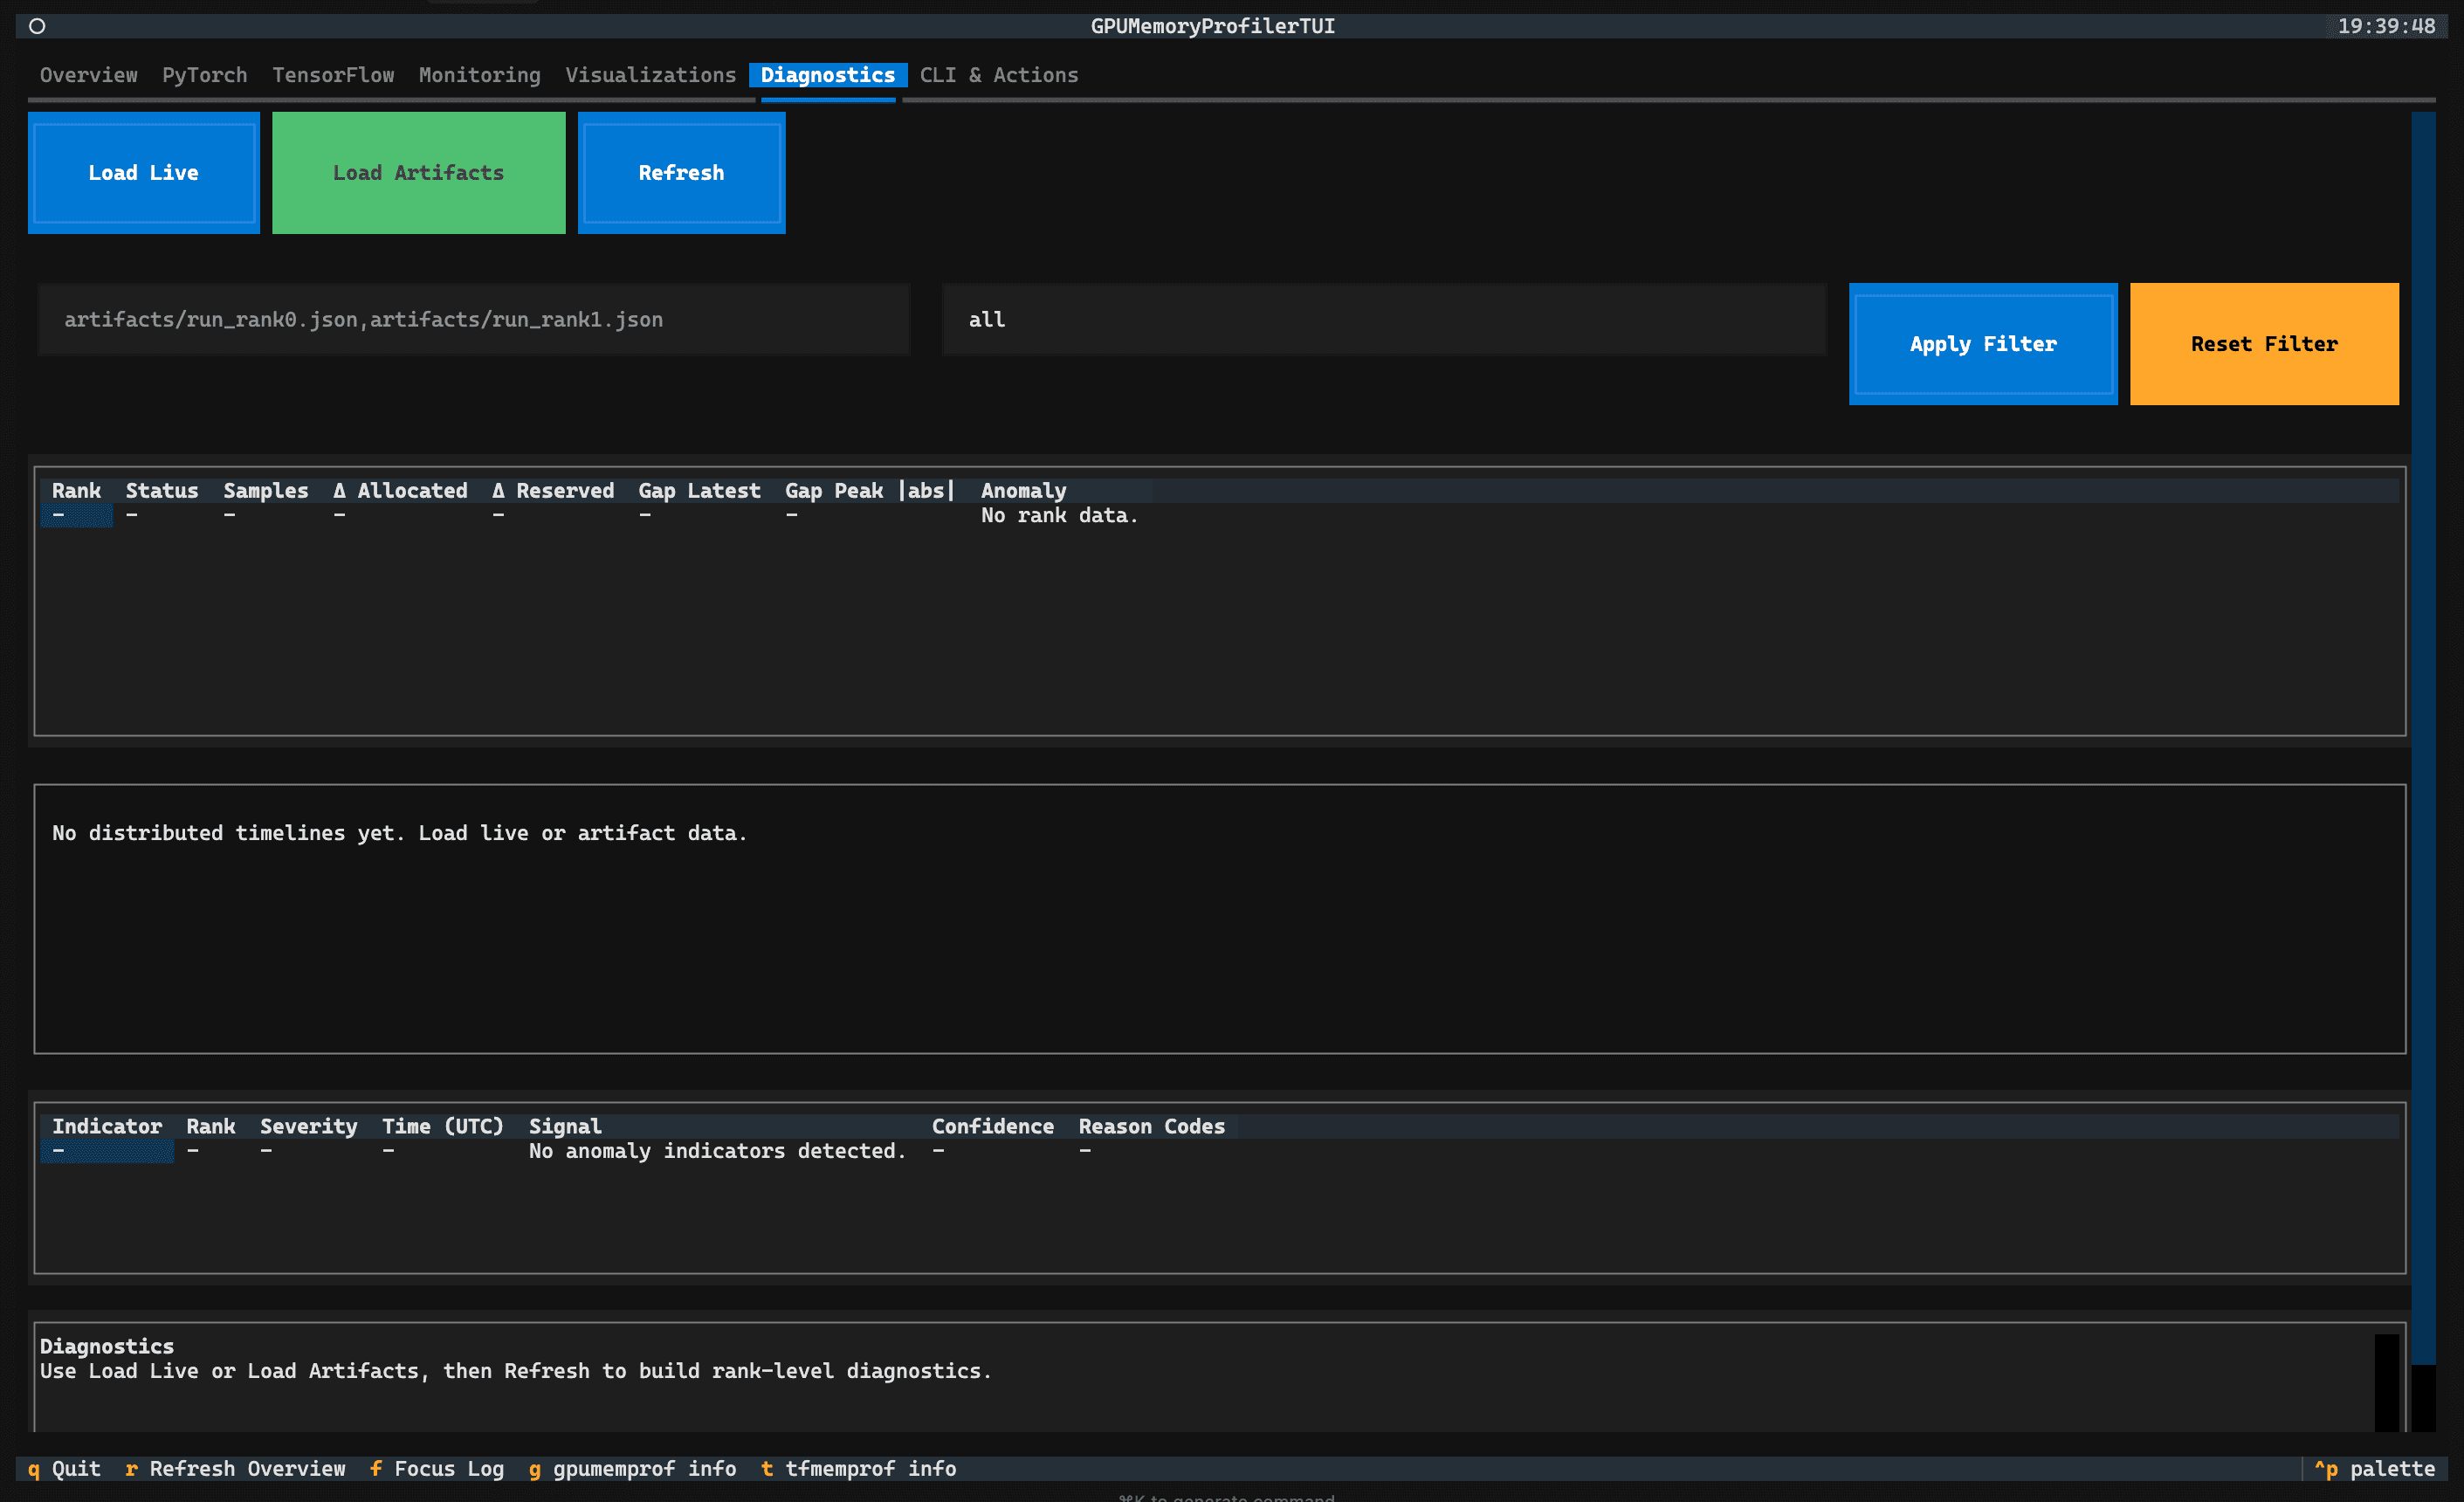
Catch leaks, rank anomalies, and regressions before they waste compute.
Stormlog turns raw allocation data into signals your team can review. Load artifacts, compare suspicious runs, filter by anomaly reason, and export proof for later triage.
Investigate distributed runs with rank-aware diagnostics
Review artifacts from prior sessions without reproducing the entire failure
Move from symptoms to concrete next steps with exportable traces
Instrument, observe, diagnose, export, optimize.
Integrate Stormlog, watch a run live, capture useful evidence, and apply fixes before the next training cycle wastes more GPU time.
Instrument
Add Stormlog to the workload you care about, from lightweight decorators to deeper session-based profiling.
from stormlog import profile

@profile(track_tensors=True, detect_leaks=True)
def train_epoch(model, dataloader):
    for batch in dataloader:
        loss = model(batch)
loss.backward()Observe
Launch the TUI or a CLI session to watch allocation, peak memory, and alerts while the training run is alive.
$ stormlog monitor --pid 12345
┌─ Live GPU Memory ──────────────────────┐
│ Allocated  16.2 / 24.5 GB              │
│ Peak       19.8 / 24.5 GB              │
│ Alerts     None                        │
└────────────────────────────────────────┘Diagnose
Inspect spikes, suspicious growth, and anomaly indicators before the next restart cycle begins.
[WARN] suspicious growth detected
tensor: grad_cache
change: +128MB over 50 iterations
signal: growth beyond thresholdExport
Ship artifacts into CI, review threads, or follow-up debugging sessions instead of relying on memory alone.
$ stormlog export --format json --output run.json
$ stormlog export --format html --output run.html

✓ timeline written
✓ diagnostics artifact savedOptimize
Use the evidence to fix leaks, restore the intended batch size, and avoid repeat OOM failures in future runs.
Before: OOM at batch_size=64
After: batch_size=64 stable again
Peak allocated: 2.04 GB → 0.09 GB

✓ 50 epochs completed
✓ zero OOM interruptionsA terminal-native workspace that still feels like a product.
Monitoring controls, visualization exports, diagnostics, and CLI-driven actions in a single interface.
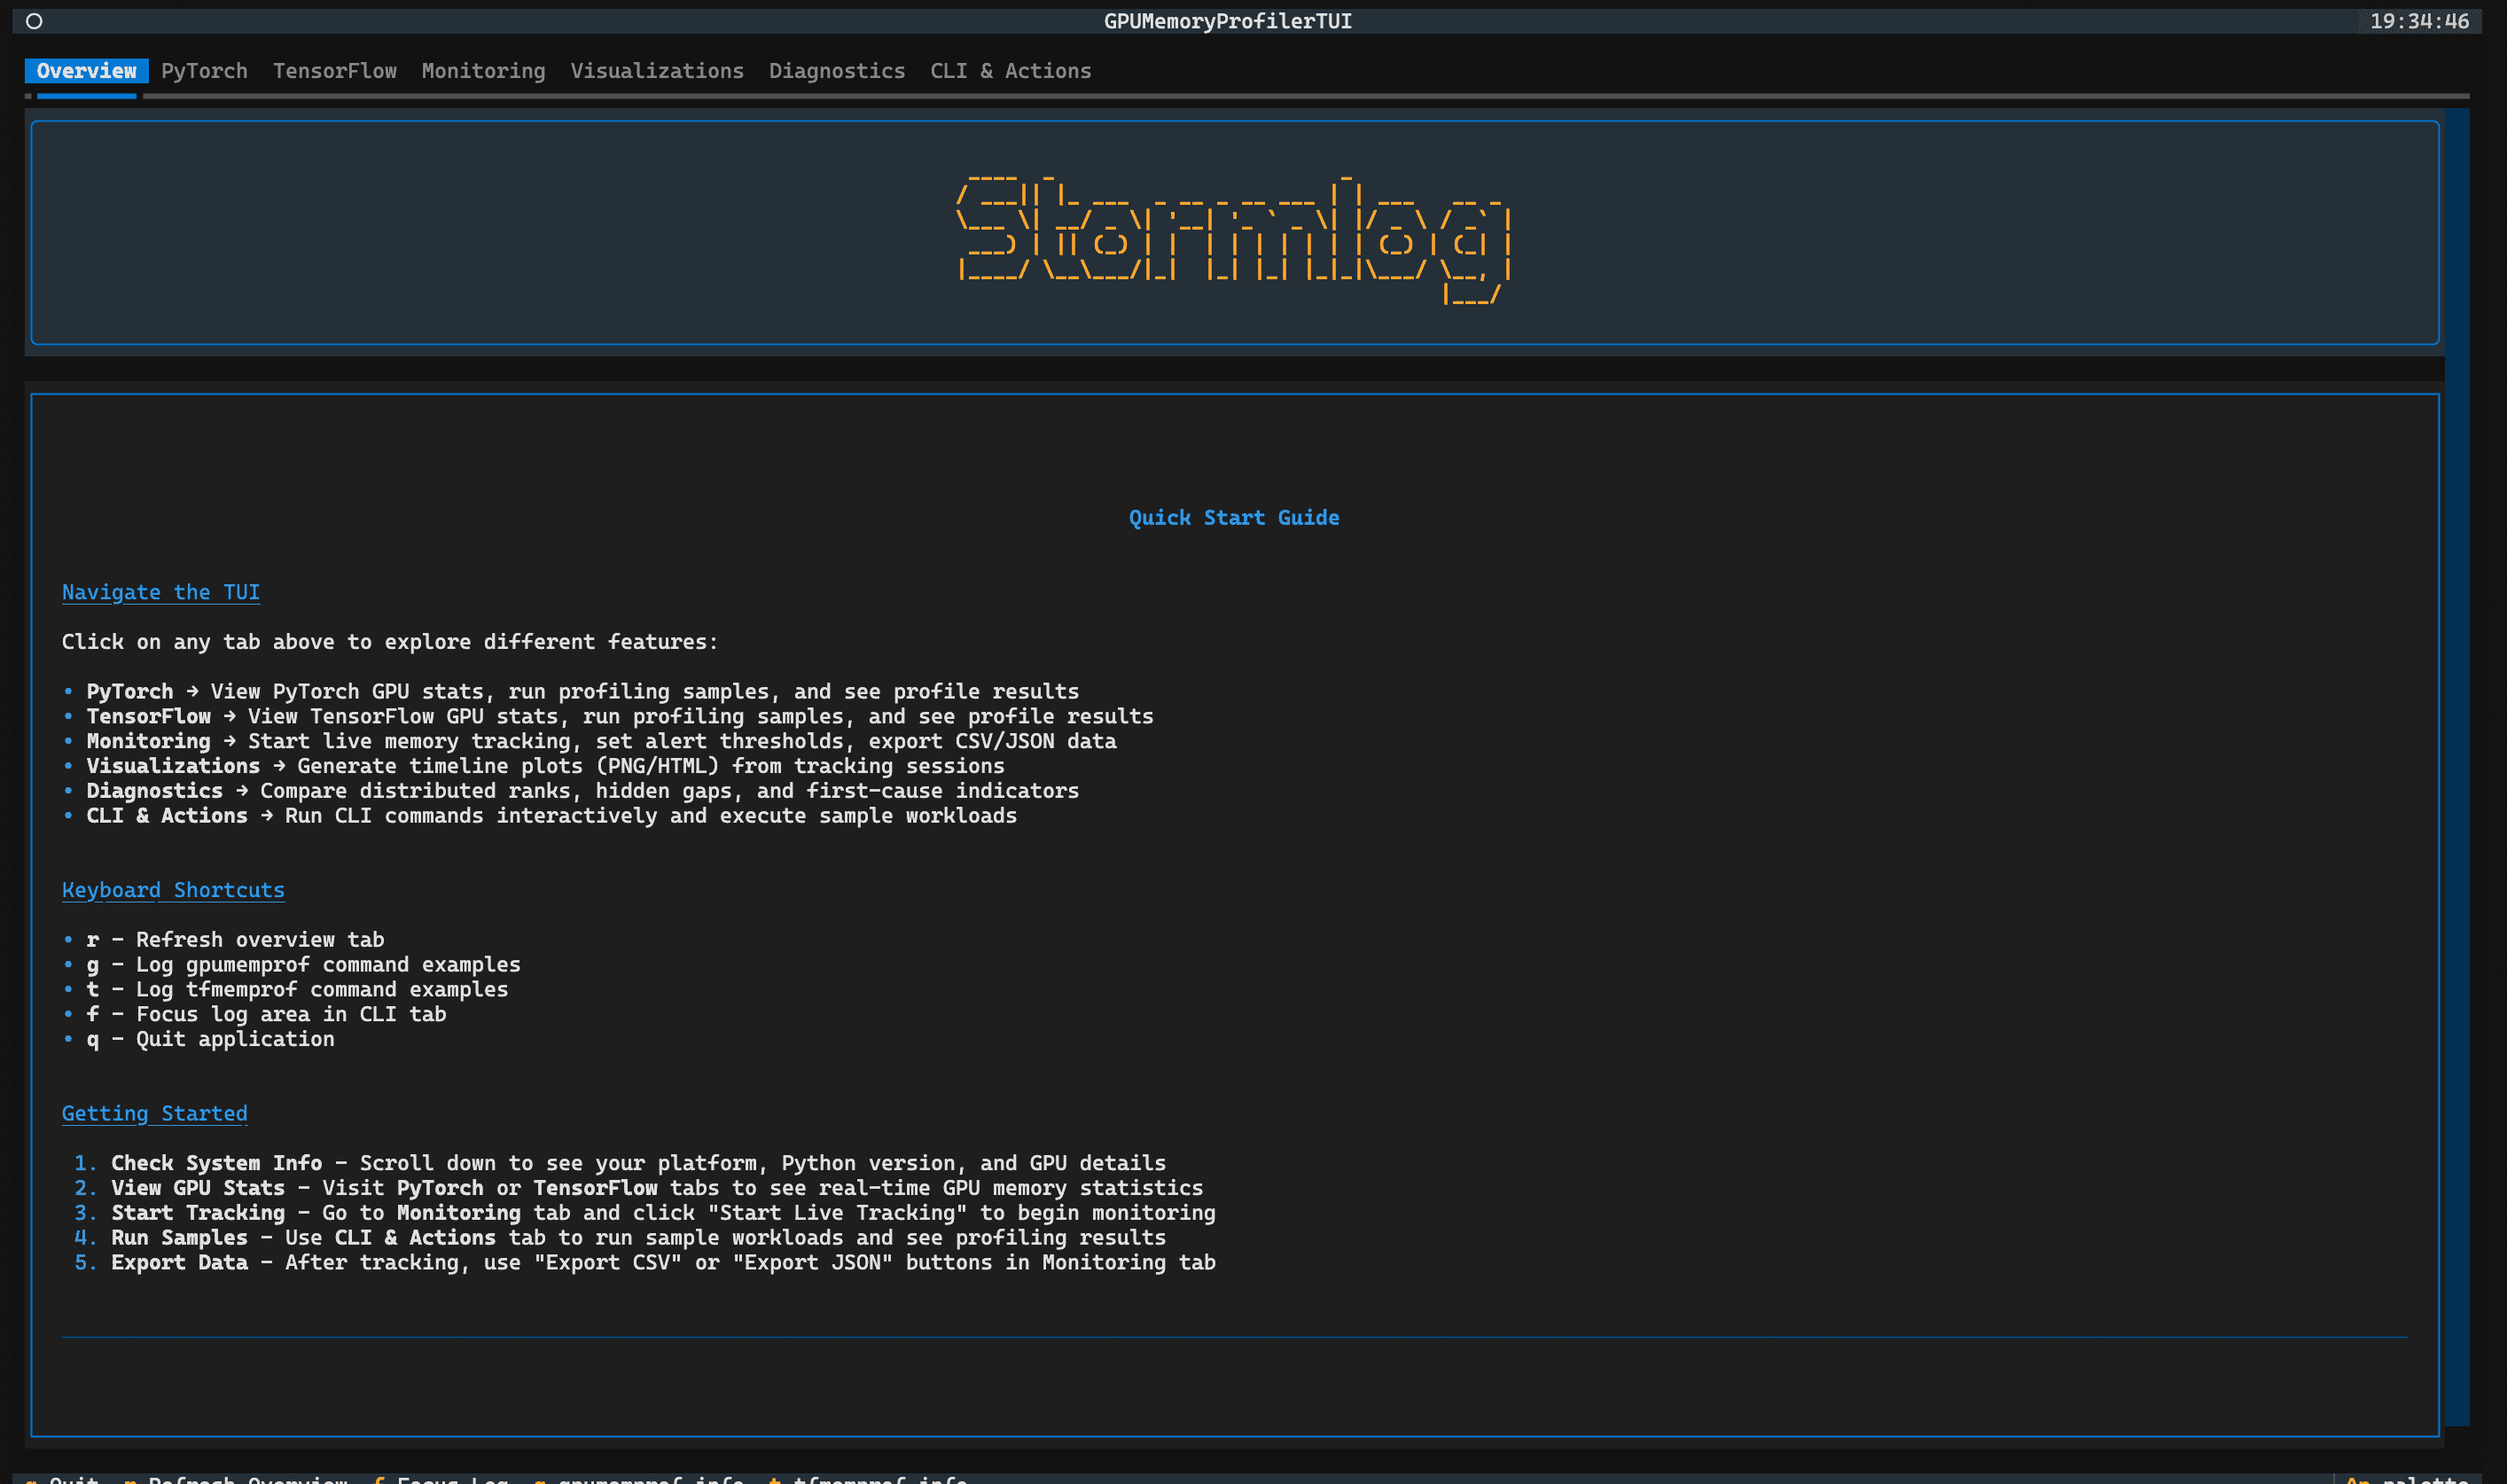
Overview
Orient new users with platform details, keyboard shortcuts, and a fast path into every Stormlog surface.
Reactive debugging vs. instrumented visibility.
Drag the divider to compare guesswork against a workflow with live monitoring, anomaly signals, and exported evidence.
$ stormlog monitor --pid 12345
Allocated 16.2 / 24.5 GiB
Peak 19.8 / 24.5 GiB
✓ live alerts enabled
[WARN] suspicious growth detected
signal: grad_cache +128MB
reason: repeated growth over threshold
✓ export diagnostics artifact
After fixing the leak
batch_size = 64 ✓ stable again
peak allocated: 2.04 GiB → 0.09 GiB
zero OOM interruptions across 50 epochs
$ python train.py
Epoch 9/50... training
Epoch 10/50... training
RuntimeError: CUDA out of memory while allocating 2.4 GiB
$ nvidia-smi
| 23476 MiB / 24564 MiB |
Which tensor grew? Which step spiked?
Fallback strategy
batch_size = 64 → OOM
batch_size = 32 → unstable
batch_size = 16 → slow but survives
Credibility comes from the repo, the docs, and the people shipping it.
Stormlog's proof is the public codebase, the published package, the documentation footprint, and the maintainers who keep the project moving.
Documentation
Installation, architecture, examples, and TUI guidance are already part of the public workflow.
Repository
Stormlog is developed in the open, with code, issue tracking, and contribution paths visible to contributors.
Package distribution
Install Stormlog from PyPI and move from setup into real profiling workflows without extra packaging steps.


Trace memory clearly, export evidence, and keep training runs stable.
Use the docs to get started, inspect the repository, or install Stormlog from PyPI for your next debugging run.